

- Cryosphere (snow and ice): Cools Earth by reflecting incoming sunlight, limiting how much heat is absorbed by the surface.
- Atmosphere (air): Insulates Earth by trapping heat and transporting heat and water vapor.
- Lithosphere (solid earth): Absorbs solar energy, radiates heat and stores carbon; continents and landforms help direct ocean and wind currents.
- Biosphere (living things): Organisms take up carbon and exchange it with the atmosphere and ocean.
- Hydrosphere (water): The ocean absorbs heat and carbon, transports them around the planet and naturally controls atmospheric CO 2.
How Does the Ocean Control Climate?


Why Earth Is Warming
UCAR Center for Science Education
Over more than a century, global average temperature warmed 1.5°F (0.8°C).

For more than 100 years, air temperature has been measured by weather observers all over the world. Averaging these daily measurements over a whole year let us see long-term trends instead of short-term weather events. And the long-term trend is that Earth is warming over time. Data collected from weather balloons (since the 1930s) and satellites (since the 1970s) also shows warming of Earth's climate.
- Learn the details of how global average surface temperature is calculated at the Calculating Global Climate Explainer.
- For an overview of how Earth's temperature is measured, check out How to Measure Global Average Temperature in Five Easy Steps.
Temperature is warming because the amount of heat-trapping gases in the air is increasing.

In 1958, Charles Keeling started taking daily measurements of the amount of carbon dioxide, a heat-trapping greenhouse gas He wanted to study the seasonal cycle that drives carbon dioxide higher when plants are dormant during Northern Hemisphere winter and lower in the summer when plants are taking carbon dioxide out of the air through photosynthesis. But Keeling found an unexpected change over time – that the total amount of carbon dioxide was increasing year after year.
The amount of heat-trapping gases has increased because of the greenhouse gases we've released into the atmosphere.

Driving cars that burn gasoline and making electricity by burning coal and gas releases carbon dioxide and other greenhouse gases into the atmosphere. Curing of cement emits carbon dioxide, too. Our landfills and farm animals also cause greenhouse gas emissions. Since the late 19th Century, when factories powered by coal became common, the amount of carbon dioxide released into the atmosphere each year has increased. The graph above shows how emissions have increased over time. Carbon dioxide can stay in the atmosphere for a long time, so emissions year after year add up. To get the amount of carbon dioxide in the atmosphere to stop increasing will take a decline in emissions similar to the increase since the 1950s. Greenhouses gases such as carbon dioxide trap heat in the atmosphere that was on its way out to space, causing Earth's greenhouse effect to grow more intense, warming the climate.
Changes in the way land is used also have an impact on climate. For example, when forests are cut down, less carbon dioxide can be taken out of the atmosphere. Agriculture also adds greenhouse gases to the atmosphere. Farm animals release methane, a particularly strong greenhouse gas, as they digest food. Factory-made fertilizers release nitrous oxide, another strong greenhouse gas into the atmosphere.
There are natural factors that can change Earth’s temperature like sunspots and volcanic eruptions, but these factors aren’t responsible for current warming. Scientists learned this by running models of the Earth system to simulate what our world’s temperature would be like over the 20th century both without human influences and with human influences. Because computers don’t know what actually happened over that time, the models consider only the factors that might affect climate and not any data about what actually happened. They found that, in fact, it would not have warmed over the 20th century and may even have cooled a bit if we hadn't been adding greenhouse gases to the atmosphere.
If we keep emitting greenhouse gases, climate will keep warming.

How much climate change we experience depends on how quickly we act during this century. If we continue to emit greenhouse gases, we'll see more far more warming during this century than we saw over the past century according to projections from Earth system models. Global average temperature will increase between 3 and 5° Celsius (5.4 to 9° F) . The good news is that this doesn't have to happen. If we find ways to spew far fewer heat trapping gasses into the air, global average temperature will increase less than 1° Celsius this century, which will keep Earth a livable place.
Next, read about how warming is affecting other aspects of our climate like precipitation, as well as the ocean, ice, ecosystems, and health.
- The Impacts of Climate Change on Water and Ice
- Shifting Ecosystems
- Impacts of Climate Change on Human Health
- Climate Change Impacts Water in the Air
UCAR Center for Science Education
https://scied.ucar.edu/learning-zone/how-climate-works/why-earth-warming
The Global Climate System
There is no more common chat topic than the weather. Weather is what might inconvenience you for a few days, but at a deeper level, climate dictates what that weather might be. It is climate which sets our long term living conditions, and climate has impacted humans since we appeared on the planet. For example, the glaciation of Earth (195,000–123,000 years ago) reduced humanity to a tiny population clinging to a coastline of South Africa (Marean 2010).
There are three basics that dictate Earth's climate, and our environment. These are: (a) solar heating of the planet balanced by energy loss to space; (b) atmosphere, ocean, land, and ice responses to heating which provide feedbacks that either mitigate or accentuate planetary temperature changes; and (c) regional environmental systems which have innate patterns of climate variability dictated by their unique physical-chemical-biological conditions. These systems respond to the planetary energy balance and also interact with one another via teleconnections.
This article examines these three basics, explaining the concepts involved using simple examples of principles. It also provides links to more detailed articles on regional climate dynamics both in the modern and in the past.
Planetary Energy Balance
If you are pale skinned (like me) and have roasted at the beach, it is hard to believe that the fierce glare of the mid-summer sun actually doesn't even provide enough energy to keep the Earth above freezing. But, if we crunch the numbers (even in a simple way) we will find that keeping the planet warm depends a good deal on the Earth amplifying the solar heat supply.
The climate system is powered by radiation from the sun, of which approximately 49% is absorbed by the Earth's surface, and 20% is absorbed by the atmosphere (Kiehl & Trenberth 1997). This energy warms the planet, but the warming also causes Earth to start radiating energy back into space. Ultimately, the temperature of the planet will be that at which energy absorbed balances energy lost.
The energy coming from the sun is principally in the shorter (including visible) wavelengths (0.3–1µm ; yellow-green visible) while the energy emitted by Earth surfaces is in the longer wavelength infrared (4–11µm). The wavelengths are dictated by the temperature of the emitter (Earth is cooler than the sun so it radiates at a longer wavelength).*
*In general terms (Harte 1988), the energy absorbed by the Earth can be written as:
EI = (1 – a) * Ω/4
‘a' is planetary albedo (0.31, this is the proportion of incoming radiation reflected to space and lost); Ω is the solar constant (solar radiation reaching Earth, in Watts m-2 , about 1367). This is energy delivered at the top of the atmosphere. We divide by 4 since the solar energy is spread over the surface of the planetary sphere. The Earth intercepts a circular area of incoming sunlight, and this area is spread over a sphere with the same radius as the circle (area of circle / area of sphere of same radius = 0.25).
The Earth will absorb energy and heat, and as it heats, it will emit radiation. The energy emitted depends on planetary temperature at the surface where radiation escapes to space. For simplicity this can be taken as the upper part of the troposphere (lower region having most of the atmosphere's mass).
Again in general terms, the energy emitted by the Earth can be written as:
EO = σ * T4 (T = temperature in Kelvin, σ = 5.67 x 10⁻⁸ J/m2 sec K4)
The Earth's temperature reaches a balance, called a steady state, when the two equations match (EI = EO). Under those conditions we can write an equation for planetary temperature.
T4 = [(1 – a) Ω] / 4 σ (T in Kelvin degrees)
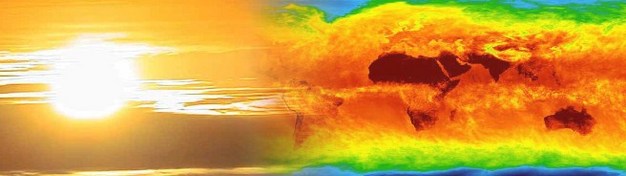
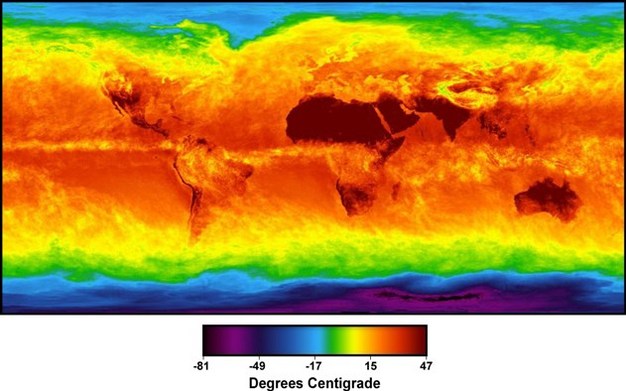
The solution for this equation with measured solar flux (Harte 1988, ERBE 2005, 2007) at the top of the atmosphere yields a value of 254° K (-19.2° C, -2.6° F) for average planetary temperature. This estimate is close to observed conditions in the upper part of the troposphere, but of course is much below the average temperature at sea or ground level (about 14° C, 57.2° F), which is the main surface of energy absorption and the place of most interest to us (Figure 1). Some factor is causing our climate to be nearly 60° F warmer than we can explain by calling on the sun alone.
The higher than expected Earth's surface temperature results from energy that is trapped and recycled in the lower atmosphere, decreasing the amount reaching higher elevation and escaping to space. Radiation emitted by the Earth is partly absorbed by water vapor and carbon dioxide in the atmosphere (greenhouse trap, Figure 2). These are heated and emit energy in all directions. The energy is trapped in a sort of maze with many pathways leading to repeated re-absorption by other gas molecules or the Earth's surface. Because of the trapping, a smaller fraction of the energy emitted by the warm Earth surface reaches the upper atmosphere and escapes to space.

The result is that the planet surface and lower atmosphere warm up, and continue warming until they emit enough energy to force the escaping fraction to match the incoming solar supply (remember that energy emitted depends on temperature). At that point energy steady state is established and planetary temperature stabilizes. The point at which steady state is reached will depend on the concentrations of infrared trapping (greenhouse) gases in the atmosphere. The greater the trapping, the higher the surface temperature must be to drive the Earth's emission towards a balance with insolation (incoming solar radiation).
Let there be Motion
Being at the beach, roasting in the sun, is made a great deal more interesting by the winds, waves, and currents on which we can play. There is motion. Our climate is an expression of that motion, all of which is caused by the planet's energy steady state. Actually, the motion is due to both vertical and horizontal energy gradients in the atmosphere and oceans. The Earth traps most of its energy at the land-ocean surface, so that the atmosphere is heated from below, and the oceans are warmed from above. Besides that, the surface heating is uneven. Much more heat is absorbed at low than at high latitudes. This is because the Earth's surface gradually tilts away from the sun (the sun is lower on the horizon) as you move away from the equator. That tilting spreads the solar energy supply over progressively larger areas of ground or ocean surface, so that each square meter gets less and less heat as you head poleward. At low latitudes the Earth's surface actually absorbs more energy that its upper atmosphere emits to space (an energy surplus) while at high latitudes the reverse is true (an energy deficit). This is because the latitudinal temperature gradient in the upper troposphere is less than the temperature gradient at the surface.
Of course, absorbing more energy than is lost at low latitudes, and the reverse closer to the poles, is not sustainable. There has to be a balancing so that temperatures stabilize across the planet, and this requires a transfer of heat from the equatorial region to higher latitudes. The transfer is done by large scale motions in the atmosphere and oceans. Motion (winds and currents) happen because solar heating, and heat loss to space, create pressure gradients. Wind and water move from high to low pressure conditions.
Up in the Air
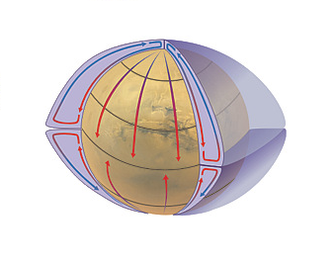
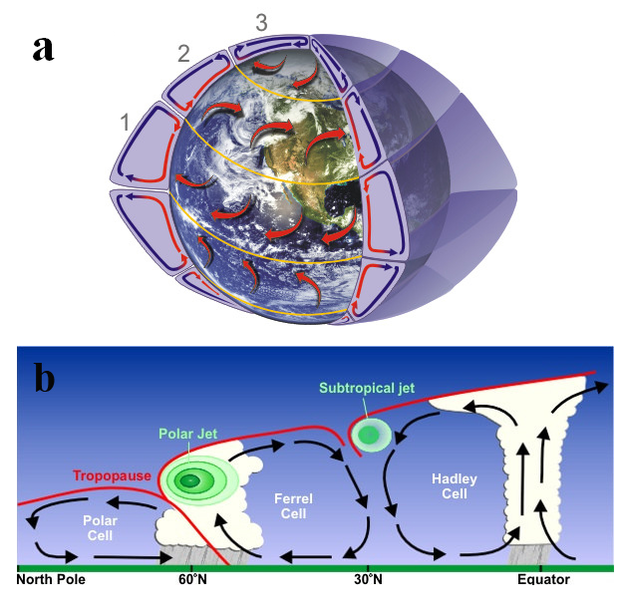
Heating the bottom of the atmosphere, especially in the tropics, makes the air less dense so it becomes buoyant and rises (think hot air balloon). This makes the atmosphere unstable and leads to air lifting to altitude, especially near the equator. Rising, lower density, air in the tropics forms the largest vertical motion in the atmosphere, the Hadley Cell (see Figures 3–4). Naturally, what goes up must come down. From the tropics the rising air spreads poleward at altitude and loses heat to space by radiation. The cooling causes density to increase and the air sinks, most intensely at about 30 degrees either side of the equator. This downward limb of the Hadley Cell creates a region of higher pressure at the Earth's surface that balances the area of low pressure along the equator. Along the surface the pressure gradient will make the winds blow from mid to low latitude. A pressure gradient also develops poleward of 30 degrees so that winds are driven to higher latitudes as well. So, from the mid-latitude surface high pressure center, winds head north and south.
The flow of the winds is made trickier by the fact that the motion is happening over a rotating surface. The Earth spins to the east and the speed of that rotation at the surface is fastest at the equator and drops to zero at the poles. That's because the speed depends on the distance which has to be covered in each daily rotation (about 24,000 miles at the equator and zero at the poles; so the rotational speed varies from about 1000 to 0 mph). Moving over a surface which is in motion has odd effects. Perhaps you have tried walking across a merry-go-round while it was turning, or across a bus when it was changing speed. The effect makes you lurch sideways. Inertia keeps you going in the direction and at the speed you had previously, while your surroundings change motion.
Air flowing towards the equator (Figure 4) is like you moving across a bus while it is speeding up. You lurch backward. For the winds, backwards is to the West (remember the Earth is rotating eastward). So, winds blowing to lower latitude get left behind as they rotate eastward at a lower speed than the surface they are traveling over (remember that rotation speed increases towards the equator). This, called the Coriolis Effect, causes winds blowing to the equator to turn towards the west. The result is a steady wind stream between 10 and 15 degrees of latitude. These are the tradewinds (also called the Easterlies, as in coming from the East).
Poleward of the high pressure center near 30 degrees latitude (Figure 4), the inverse of the trades is generated because air flowing poleward moves over a surface which is rotating at slower and slower speeds. In this case, the bus is slowing down as you attempt to cross it. The winds veer to the east as their eastward motion outstrips that of the surface they are flowing over. In this way a steady flow from west to east (the Westerlies) is created at about 45 degrees latitude.
The Hadley Cell, Easterlies at low latitude and Westerlies at mid-latitude are the basic motions of the atmosphere. Combined, the vertical and horizontal movements of the winds serve to collect heat in tropical regions and transfer it poleward. This is one part of the planetary energy balancing act.
Under the Sea
The surface winds blow over the oceans and they move water. Surface currents are generated by the tradewinds and the Westerlies. This is water responding to the friction of the winds on the sea surface. Of course, as the water begins to move, the Coriolis Effect comes into play and the currents veer westwards if going to lower latitudes and easterwards if going poleward. Surface ocean currents are driven in circles called gyres (see them in action at:
https://oceanservice.noaa.gov/facts/gyre.html https://rwu.pressbooks.pub/webboceanography/chapter/9-1-surface-gyres/
The largest of these, the subtropical gyre, fills the middle of all oceans and rotates such that poleward flow is on the western side of the basin. Heat transfer from low to high latitudes is via the western boundary currents of the oceans (like the Gulf Stream in the N. Atlantic). This is another part of the planetary energy balancing act.
The surface currents of the oceans operate in a relatively thin upper layer of the sea which is heated by the sun. This heating is kept relatively close to the ocean surface because warming water makes it less dense and more resistant to sinking or mixing downwards. The result is a barrier, called the thermocline, which develops particularly at lower and mid-latitudes (it is more seasonal poleward) and that separates surface waters from the deep ocean. The boundary, marked by a rapid downward temperature drop, usually occurs within a few hundred meters of less of the surface. Below it, the greater mass of the oceans (down to an average depth of about 3800m) is cold and isolated from the winds.
Since the oceans are warmed from above, and heating makes water less dense, you might expect the greater depths to be isolated and stagnant since light surface water would be resistant to mixing downwards and would sit like a lid on the ocean basins. Nevertheless, the deep sea is in motion. Flow in the deep sea is initiated where the normal, density layered, oceanic water column breaks down and surface water sinks due to processes which raise its density. The primary cause of water column destabilization is extreme cooling over a large depth range combined with sea-ice formation. Making ice, which is fresh, leaves behind a brine which is quite salty and so quite dense. The brine heads for the deep sea. It supplies the great deep ocean water masses, the North Atlantic Deep Water and the Antarctic Bottom Water.
The deep water masses develop at high latitudes, particularly in the Atlantic basin. Waters sink to ocean bottom depths SE of Greenland and in the Atlantic sector of Antarctica (Weddell Sea). You can see the deep ocean current flow that results at: http://svs.gsfc.nasa.gov/. Naturally what goes down must come up if deep currents are going to continue to flow. Deep waters born in the Atlantic spread to the other ocean basins using the circum-planetary highway that surrounds Antarctica (see the animation link above). This seaway serves as the roundabout connecting all the world's oceans and allowing deep Atlantic water to spread ultimately to the Pacific. On average, the trip takes about 800 years. Along the way water finds return routes to the surface. Since the deep waters are more dense than those at the surface, energy has to be used to pump them up. Ultimately, the energy is provided by the planetary heat gradients as these drive wind and deep ocean flow.
The winds provide upward draw on deep waters thanks to the Coriolis Effect. Along the eastern sides of ocean basins and around Antarctica winds blow such that Coriolis veering drives them oceanward, away from the land margin. The surface waters are drawn away from the coast. The result is a process called Upwelling (see the concept at: http://www.classzone.com/) which causes deeper water to rise and replace the water pulled away from the shore. Upwelling is particularly effective around Antarctica because the water column there is uniformly cold, which means that the thermocline barrier to vertical motion is weak and waters can be drawn up from depth. As a result, upwelling in the Southern Ocean provides one of the main avenues by which deep waters eventually surface (see more on this and climate below). Once there, solar warming will lead to decreasing density and a return of water to the upper ocean circulation system. Upwelling isn't the only way out of the deep sea. Any process which encourages vertical mixing will transfer water out of the depths. Water flowing over variable seabed topography can experience strong mixing which is particularly effective where the vertical temperature gradients are weak (limited thermocline) as often happens at higher latitudes. Where the sea bottom is rough, the flow of deep currents by itself generates upward motion in the water column (Naveira Garabato et al. 2004).
Deep water flow gives a third dimension to the ocean's
response to the planetary temperature gradient. The
cycle of surface and deep ocean circulation, called the
Meridional Overturning Circulation (MOC) is vital to the
distribution of heat, chemicals and life in the oceans.
It is sensitive to anything which will alter seawater
densities in regions where sinking occurs (Rahmstorf
2006), or any process which changes winds and
ocean-atmosphere interaction in upwelling areas. Natural
or human induced climate change can do both, so ocean
circulation is responsive to climate conditions
(Rahmstorf 2002). Interestingly, deep ocean circulation
can also feedback into climate change to alter the way
it develops (see feedbacks below).
Feedbacks in the Climate System
That hot day at the beach needs more than just the sun; the Earth has to augment solar heating through a response to the sun's energy. This positive feedback is primarily due to water vapor in the atmosphere. Water vapor, like carbon dioxide, traps radiation emitted by the Earth (Figure 2). The amount of water vapor in the atmosphere increases with temperature (Figure 5). So, warming the Earth adds water vapor to the atmosphere, and adding water vapor to the atmosphere magnifies that warming. Notice that the water vapor relationship to temperature (Figure 5) is exponential, so that under warmer conditions, a modest increase in temperature can lead to a large increase in water vapor and associated greenhouse effect. The oceans provide the exposed water surface which allows the atmosphere to saturate with water vapor, especially where it is warm as in the tropics. A nice view of the water vapor lifted from the oceans is provided by the following link which shows a computer model visualization of clouds and atmospheric circulation (clouds tend to form where warm, wet air is rising in the atmosphere): http://wn.com/. The water vapor response is the primary cause of greenhouse warming on Earth, and it will magnify the warming effects of other gases, such as carbon dioxide. It is estimated (Solomon & Dahe 2007a, Murphy et al. 2009)that about 60% of the surface warming we calculated above is due to water vapor in the atmosphere.

The water vapor effect might sound terminal for planet Earth since it feeds progressive warming. However, it is balanced by cloud formation, which increases planetary albedo, reducing solar energy that reaches the lower atmosphere and Earth's surface. This cloud effect provides negative feedback on planetary temperature. Cloud formation depends on water vapor content of the atmosphere and the lapse rate (temperature change with elevation). The role of clouds in balancing positive feedback from greenhouse gases is complex (Ramanathan et al. 1989). The response of cloudiness to changes in greenhouse gas concentrations is still not well understood (Solomon & Dahe 2007b) .
Planetary Temperature Juggling
We are able to observe the planetary energy balancing act at work thanks to the unintended experiment which humanity is conducting by adding carbon dioxide to the atmosphere. Since CO2 is a greenhouse gas, we would expect to see the following: increased energy trapping in the troposphere, increased surface temperature in response, and decreased temperature in the stratosphere. The stratosphere sits above the troposphere and the effective level at which the Earth radiates to space. It is heated from below and as less infrared escapes the troposphere bound for outer space, stratospheric temperatures should drop. The resulting planetary energy inequality, with incoming greater than outgoing, would result in global warming. Eventually, for a given quantity of greenhouse gas added to the atmosphere, we would expect the stratosphere to return to its original temperature as the Earth's surface warms enough to force the upper troposphere to emit energy at a rate which matches the incoming solar supply. The current adjustment period, with lower stratospheric temperatures, is called a Transient (a shift from one steady state to another).
The greenhouse warming transient in troposphere-stratosphere temperatures has been investigated with models (Figure 6). These predictions can be compared to observations (Figure 7), and we see that expected trends in both surface and lower stratosphere temperatures have developed.

As atmospheric composition responses to solar warming provide positive feedback on planetary temperature, other responses mitigate change and provide negative feedback. Negative responses could increase planetary reflectivity, so less solar energy is absorbed by Earth; or they might prevent significant changes in atmospheric composition. Dominance of climate/environmental processes by negative feedback would lead to homeostasis, a concept developed by James Lovelock (1989). For example, it has been proposed the increased heating of the western topical oceans (where the warmest oceans are) could enhance upper level cloud formation and screen solar input to the surface (an ‘adaptive iris' for the Earth (Lindzen et al. 2001). Evidence for this is equivocal (Hartman and Michelsen 2001; Lin et al. 2002). It has also been proposed that biogeochemical responses in the oceans (phytoplankton release of cloud nucleating precursor molecules) would provide energy input buffering through a cloudiness control mechanism (Charlson et al. 1987).
How much stabilization the Earth's climate gets from negative feedbacks is, at least in part, revealed by the climate history of the Pleistocene (past 2 million years) during which the Ice Ages occurred and planetary temperature dropped (4–5°C). It is a fact that large climate changes occurred across the globe, and that atmospheric carbon dioxide concentrations co-varied with the temperature changes (Figure 8). Indeed, the carbon dioxide variations help to account for 50% fraction of the Ice Age temperature changes (Solomon & Dahe 2007d). This is what we would expect from positive, rather than negative, feedback processes.

Oceanic CO2 Give and Take
One interesting idea (Toggweiler 1999) connects ocean circulation to atmospheric carbon dioxide content and planetary temperature, so that climate change alters circulation and then circulation can alter climate (a positive feedback). This idea takes us to the Southern Ocean surrounding Antarctica where deep ocean water upwells and returns to the surface circulation system. This deep water is cold, and it contains lots of dissolved carbon. The oceans actually hold more carbon (in dissolved form) than the atmosphere, and water in general holds more carbon by volume than does air. How much carbon water holds depends on several factors, temperature most importantly. The colder water is, the more CO2 it can absorb (think of a cold fizzy drink versus one you have let warm up for a few hours). So, cold surface ocean can, and does, absorb CO2 from the atmosphere. Naturally, this happens at polar latitudes, and in the Atlantic, these cold waters can sink into the deep sea. This makes the deep ocean a repository for dissolved carbon. In addition to physically absorbing carbon dioxide, the oceans also do so biologically as plant life captures CO2 dissolved into surface waters and converts it to organic matter (photosynthesis). Some of that settles in the water column and is digested at depth, transferring the carbon to the deeps (the ocean grave yard).
The result of carbon transfer to depth in the oceans is that abyssal water is carbon enriched, and when it rises to the surface it will give up a fraction of its carbon load to the atmosphere, de-gassing CO2 as it warms. This gives us a vertical cycle of CO2 transport with sinking cold water at the poles drawing carbon to the deeps and upwelling bottom water surfacing, warming, and releasing carbon to the atmosphere. How much CO2 there is in the atmosphere depends, in part, on the balance of oceanic drawdown and release.
That balance could be altered if ocean circulation changed so that exchange between the surface and the abyss was reduced (Figure 9). It has been proposed that this happened during the ice ages when sea-ice spread outwards from Antarctica and at least partially covered regions where deep upwelling happens today. Also, it may be that the westerly winds which roar over the circum-Antarctic ocean were weakened under glacial conditions. If so, upwelling would have been reduced. The ice and weaker winds would have slowed the drawing up of deep water to the surface and interfered with ocean-atmosphere gas exchange. So, the oceans would have kept more CO2 locked up and the atmosphere's content would have been less, enhancing the glacial cooling. On the flip side, if a warming led to sea-ice melting and strengthening of westerlies, then deep ocean upwelling would be stimulated. With more upwelling, increased volumes of CO2 could be released to the atmosphere and warming would be accelerated. This could account for the lock step pattern in atmospheric CO2 and glaciations which we observe (Figure 8) and the positive feedback that the climate record implies.
What if the Sun Wasn't So Bright?
The greenhouse warming model developed above shows how the planetary energy balance can be changed by varying atmospheric composition even when solar energy supply remains constant. However, the planetary energy balance will also change if the solar flux was altered. The degree to which this happened in more recent geological time is uncertain (Foukal et al. 2006). However, the solar energy reaching different regions of the Earth has certainly changed over time in response to cycles in the Earth's orbit around the sun (Berger 1978, Berger & Loutre 1992) (Figure 8). These cause variation in the season of Earth's closest approach to the sun (precession), the Earth's tilt (obliquity) with respect to the orbital plane, and the ellipticity of the Earth's orbit around the sun. The combination of these cycles changes energy delivered to different parts of the Earth's surface with perhaps the greatest impact at higher latitudes. Although the changes are relatively modest, the climate response has been large (again indicating positive feedbacks) as the ice ages have fluctuated to the beat with the orbital parameters (Hays et al. 1976).
The impact of the orbital parameters (Figure 8) depends on latitude with the slower parameters (obliquity, tilt) dominant at high latitudes and precession more important near the equator. The climate cycles triggered by the orbital variations are an amalgam of all the cycles (Figure 8) indicating that Earth process feedbacks have acted over a range of latitudes and magnified the energy distribution cycles coming from space. Notice that sometimes energy cycles across latitudes can mesh (Figure 8, around 120 kyr, post-20 kyr) and that at these times large changes in climate occurred (onset of glaciation, last de-glaciation).
The sort of feedback which could magnify subtle variations in energy supply (on the order of 5%) due to orbital factors could include the changes in ocean circulation explained above. The reduction in CO2 concentration observed, and possibly due to the ocean carbon cycle (Figure 8), appears to explain about one half of the planetary cooling observed during glacials (Solomon & Dahe 2007). The feedbacks involved are complex but seem to include not only increased glacial carbon dioxide storage in the deep sea due to greater stratification of the ocean (Toggweiler 1999, Toggweiler et al. 2006, Watson & Naveira Garabato 2006) , but also changes in marine algal ecosystems (Matsumoto et al. 2002) accompanied by redistribution of the chemical nutrients they depend on (Loubere & Fariduddin 2008) combining to change ocean carbonate chemistry (Broecker & Peng 1989) in such a way as to draw carbon dioxide from the atmosphere. The sequence of events which would explain the observed record of carbon dioxide in the atmosphere has yet to be worked out.
Global Climate: The Sum of Parts
The Earth's climate system is made up of regions which respond differently to changes in the planetary energy balance. These separate units, or modes, have dynamics controlled by physical-chemical boundary conditions of those regions. In spite of their local nature, the modes interact through teleconnections. The modes are like performers on a tight-rope, each individual carrying different items and doing different acts, but each reactive to the others through the rope they share. Tension on that rope could serve as an analogy for the planetary energy supply. Changing the tension will impact actions by the performers (modes) and also affect how the performers interact.
The modes and their teleconnections are not completely understood. Perhaps the best examined is ENSO (El Nino Southern Oscillation) centered in the tropical Pacific. This mode controls distribution of ocean surface temperatures across the tropics, the distribution and abundance of marine organisms, and the distribution of rainfall around the Pacific basin (Philander 1990). It oscillates chaotically between two phases (warm vs. cool eastern Pacific) on a 2 to 7 year period (Link to ENSO article). The phase switching and periodicity are controlled by physical characteristics of the tropical Pacific basin and ocean-atmosphere interactive feedbacks (Wang & Fiedler 2006). ENSO can produce wild fires in the normally wet tropical rainforests of Southeast Asia and floods in the deserts of western South America. In addition, it propagates beyond the tropics through both ocean and atmosphere teleconnections (Alexander et al. 2002) to impact weather as far north as Alaska and as far away as eastern Canada.
Another mode, the PDO (Pacific Decadal Oscillation) exists in the higher latitude North Pacific (Mantua et al. 1997). This has a longer periodicity (20-30 years) and involves changes in sea surface temperatures as well as atmospheric pressures across the North Pacific. It is thought that the PDO oscillation results from an interaction of ENSO generated variation in ocean temperatures, ocean circulation in the NE Pacific and highly variable atmospheric conditions (a ‘random' factor). There is a teleconnection (Alexander et al. 2002) whereby ENSO provides pacing which is filtered through the regional scale ocean-atmosphere circulation. The PDO affects ocean temperatures, precipitation and distributions of ocean life across the Northern Pacific (Chavez et al. 2003). Its behavior is dictated by features of the N. Pacific basin, but it responds to ENSO and the tropics. It is likely that altering ENSO will alter PDO. The possibility of change in ENSO due to variation in the planetary energy balance is an area of active research (Timmermann et al. 1999, Federov & Philander 2002, Merryfield 2006).
Key issues in the behavior of regional climate systems are thresholds at which switching of conditions can occur and the sequence of feedbacks which govern the switching process. Examples of feedback and conditions for switching can be found in the linked articles on Atlantic Overturning Circulation and on ENSO. The issue of sequencing of environmental responses leading to climate system change is addressed in the linked article on Glacial Cycles.

Together we CAN fix the climate crisis: people power is stronger than what's standing in the way, namely the fossil fuel industry.
— 350.org Europe (@350Europe) August 10, 2021
We'll keep fighting for our future and to #EndFossilFinance. Join us 👉 https://t.co/tgiKI8A2ct pic.twitter.com/3QU1Rztxov
List of environmental issues
This is an alphabetical list of environmental issues, harmful aspects of human activity on the biophysical environment. They are loosely divided into causes, effects and mitigation, noting that effects are interconnected and can cause new effects.
Issues
- Human overpopulation — Biocapacity climate change• Carrying capacity • Exploitation • Industrialisation • I = PAT • Land degradation • Land reclamation • Optimum population • Overshoot (population) • Population density • Population density • Population dynamics • Population growth • Projections of population growth • Total fertility rate • Urbanization • Waste • Water conflict• Water scarcity • Overdrafting
- Hydrology — Environmental impacts of reservoirs • Tile drainage • Hydrology (agriculture) • Flooding • Landslide
- Intensive farming — Agricultural subsidy • Barn fires • Environmental effects of meat production • Intensive animal farming • Intensive crop farming • Irrigation • Monoculture • Nutrient pollution • Overgrazing • Pesticide drift • Plasticulture • Slash and burn • Tile drainage • Zoonosis
- Land use — Built environment • Desertification • Habitat fragmentation • Habitat destruction • Land degradation • Land pollution • Lawn-environmental concerns • Trail ethics • Urban heat island • Urban sprawl
- Nanotechnology — Impact of nanotechnology
- Natural disasters
- Nuclear issues — Nuclear fallout • Nuclear meltdown • Nuclear power • Nuclear weapons • Nuclear and radiation accidents • Nuclear safety • High-level radioactive waste management
- Ocean trash — Garbage patch • Ghost net • Washed Ashore
- Water pollution
Effects
- Climate change — Global warming • Global dimming • Fossil fuels • Sea level rise • Greenhouse gas • Ocean acidification • Shutdown of thermohaline circulation • Environmental impact of the coal industry • Urban Heat Islands • Flooding
- Environmental degradation — Habitat destruction • Invasive species
- Environmental health — Air quality • Asthma • Birth defect • Developmental disability • Endocrine disruptors• Environmental impact of the coal industry • Environmental impact of nanotechnology • Electromagnetic field • Electromagnetic radiation and health • Indoor air quality • Lead poisoning • Leukemia • Nanotoxicology • Nature deficit disorder • One Health • Sick Building Syndrome • Environmental impact of hydraulic fracturing
- Environmental issues with energy — Environmental impact of the coal industry • Environmental impact of the energy industry • Environmental impact of hydraulic fracturing
- Environmental impact of transport
- Environmental issues with war — Agent Orange • Depleted uranium • Military Superfund site (Category only) • Scorched earth • War and environmental law • Unexploded ordnance
- Overpopulation — Burial • Overpopulation in companion animals • Tragedy of the commons • Gender Imbalance in Developing Countries • Sub-replacement fertility levels in developed countries
- Mutation breeding — Genetic pollution
- Synthetic biology — Synthetic DNA • Artificially Expanded Genetic Information System • Hachimoji DNA
- Genetically modified food — Genetically modified crops • Genetically modified livestock • Genetically modified food controversies
- Pollution — Nonpoint source pollution • Point source pollution
-
- Air pollution — Environmental impact of the coal industry • Environmental impact of hydraulic fracturing • Indoor air quality • Smog • Tropospheric ozone • Volatile organic compound • Atmospheric particulate matter CFC • Biological effects of UV exposure
- Light pollution • Visual pollution
- Noise pollution
- Soil pollution — Alkali soil • Brownfield • Residual Sodium Carbonate Index • Soil conservation • Soil erosion • Soil contamination • Soil salination • Superfund • Superfund sites
- Water pollution — Acid rain • Agricultural runoff • Algal bloom • Environmental impact of the coal industry • Environmental impact of hydraulic fracturing • Eutrophication • Fish kill • Groundwater pollution • Groundwater recharge • Marine debris • Marine pollution • Mercury in fish • Microplastics • Nutrient pollution • Ocean acidification • Ocean dumping • Oil spills • Soda lake • Ship pollution • Thermal pollution • Urban runoff • Wastewater
- Space debris • Interplanetary contamination • Ozone depletion
- Resource depletion — Exploitation of natural resources • Overdrafting (groundwater) •Overexploitation
-
- Consumerism — Consumer capitalism • Planned obsolescence • Over-consumption
- Fishing — Blast fishing • Bottom trawling • Cyanide fishing • Ghost nets • Illegal, unreported and unregulated fishing • Overfishing • Shark culling • Shark finning • Whaling
- Logging — Clearcutting • Deforestation • Illegal logging
- Mining — Acid mine drainage • Environmental impact of hydraulic fracturing • Mountaintop removal mining • Slurry impoundments
- Water (depletion) — Anoxic waters • Aral Sea • California Water Wars • Dead Sea • Lake Chad • Water scarcity
- Toxicants — Agent Orange • Asbestos • Beryllium • Bioaccumulation • Biomagnification • Chlorofluorocarbons (CFCs) • Cyanide • DDT • Endocrine disruptors • Explosives • Environmental impact of the coal industry • Herbicides • Hydrocarbons• Perchlorate • Pesticides • Persistent organic pollutant• PBBs • PBDEs • Toxic heavy metals • PCB • Dioxin • Polycyclic aromatic hydrocarbons • Radioactive contamination • Volatile organic compounds
- Waste — Electronic waste • Great Pacific Garbage Patch • Illegal dumping • Incineration • Litter • Waste disposal incidents • Marine debris • Medical waste • Landfill • Leachate • Toxic waste • Environmental impact of the coal industry • Exporting of hazardous waste
Mitigation
- Mitigation of aviation's environmental impact – Aviation taxation and subsidies (Air passenger tax • Kerosene tax) • Electric aircraft
-
Conservation
- Ecosystems — Anoxic waters • Biodiversity • Biosecurity • Coral bleaching • Black carbon • Edge effect • Habitat destruction • Organic farming • Habitat fragmentation • In-situ leach
- Fishing — Blast fishing • Bottom trawling • By-catch • Cetacean bycatch • Gillnetting • Illegal, unreported and unregulated fishing • Environmental effects of fishing • Marine pollution • Overfishing • Whaling
- Forests — Clearcutting • Deforestation: reforestation and afforestation • Illegal logging • Trail ethics
- Natural resources — Resource depletion • Exploitation of natural resources • Steady-state economy
- Species — Endangered species • Genetic diversity• Habitat destruction • Holocene extinction • Invasive species • Poaching • Pollinator decline • Species extinction • Threshold host density • Wildlife trade • Wildlife disease
- Energy conservation — Efficient energy use • Carfree city • Local food
- Renewable energy — Renewable energy commercialization
- Recreation — Protected areas
- Water conservation
- Disaster mitigation
- Environmental law — Environmental crime • Environmental justice • Polluter pays principle • Precautionary principle • Regulatory capture • Trail ethics
- Phase-out of fossil fuel vehicles
- Phase-out of single-use plastics
- Sustainable agriculture
See also
- Citizen Science, cleanup projects that people can take part in.
- Environmental history
- Environmental history of Latin America
- Environmentalism
- Environmental racism
- Environmental racism in Europe
- Global issues
- Index of environmental articles
- List of conservation topics
- List of environmental disasters
- List of environmental organizations
- List of population concern organizations
- List of sustainability topics
- Lists of environmental topics
- List of environmental organisations topics
- Millennium Ecosystem Assessment


